
How D-SAL turns sunlight into fresh and purified water
The technology has reached TRL 5, with a proof of concept and first-stage prototype developed at the University of Zurich (UZH). The prototype was field-tested under real-world conditions at UZH and at the KAUST Red Sea campus in Saudi Arabia.
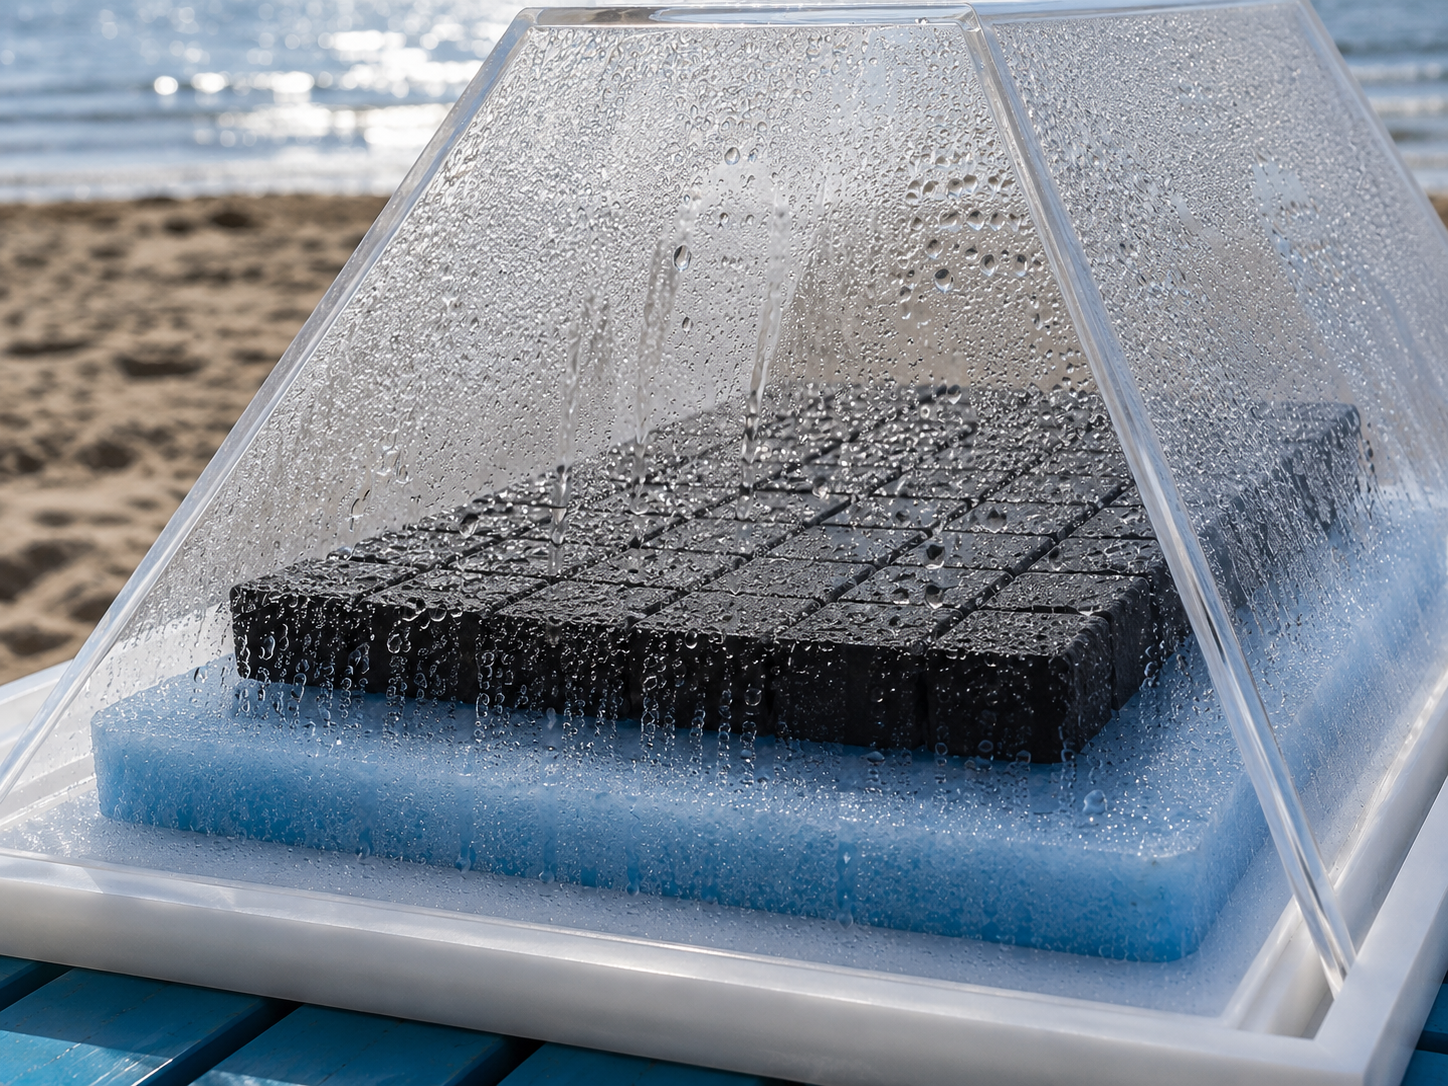
Field prototype — KAUST Red Sea campus, Saudi Arabia. Transparent enclosure condenses vapour from the solar-heated carbon absorber; fresh water droplets form on the inner surfaces and drain into a collection channel.
01/How it works
The cycle, in five steps
- 01
Transport
Saline water rises into the structure
Cotton fibres and the porous carbon architecture transport saline or brackish water toward the evaporation surface by capillary action. No high-pressure pump is required.
- 02
Adsorb
Water moves through micro- and nano-channels
The carbon and cotton network adsorbs water molecules and draws them through micro/nano channels toward the surface.
- 03
Capture
Sunlight triggers evaporation at the surface
The floating carbon layer captures broadband light. Rather than heating the whole body of water, the light energy drives evaporation from the wetted surface.
- 04
Evaporate
Heat is concentrated at the interface
Because water reaches all exposed surfaces, evaporation happens from the whole surface area, not just a single water-to-air boundary.
- 05
Condense
Vapour is recovered as purified water
The surrounding desalination architecture captures the vapour, which condenses on the cooler surface and flows into a purified-water collection stream.
Beyond the single-surface limit
D-SAL does not rely on heating the entire water volume. Water is drawn through the carbon structure and then released to evaporate from every exposed surface. The result is a higher effective water-to-vapour conversion than a conventional solar still, where evaporation is limited to one flat surface.
What the architecture removes
No high-pressure pump
Capillary transport replaces hydraulic lift.
No grid electricity required for evaporation
Evaporation is driven by incident sunlight alone.
No pressure vessel
Nothing in the water path is pressurised.
How the material purifies the water
Micro- and nano-channel network
The carbon structure is a porous network of micro-sized channels — tens of microns to hundreds of nanometres — opening into nanochannels that spread and intercross in every direction. This highly interconnected, disordered structure creates a large surface area where adsorption can take place.
Adsorption + CCP barrier
Through adsorption, toxic compounds and other pollutants stay on the carbon surface. Together with the carbonized compressed powder (CCP) and cotton fibres, the absorber helps prevent organic and inorganic macro-molecules — including bacteria, parasites, microplastics and heavy metals — from reaching the thermally active part of the device.
Reported · Advanced Sustainable Systems, 2021. The mechanism describes what the material is designed to adsorb and help exclude; it is not a claim of 100% removal of any specific contaminant without further validation.
02/The material
The adsorber is a porous carbon structure coupled to cotton fibres that transport water through the material by capillary action and adsorption. Early experiments at the University of Zurich investigated both coconut and wood charcoal, including liquid-nitrogen treatment as a way of modifying porosity. Scanning electron microscopy was used to directly examine the resulting pore and channel structures.
Figure 2.1 · Scanning electron microscopy, ZMB University of Zurich
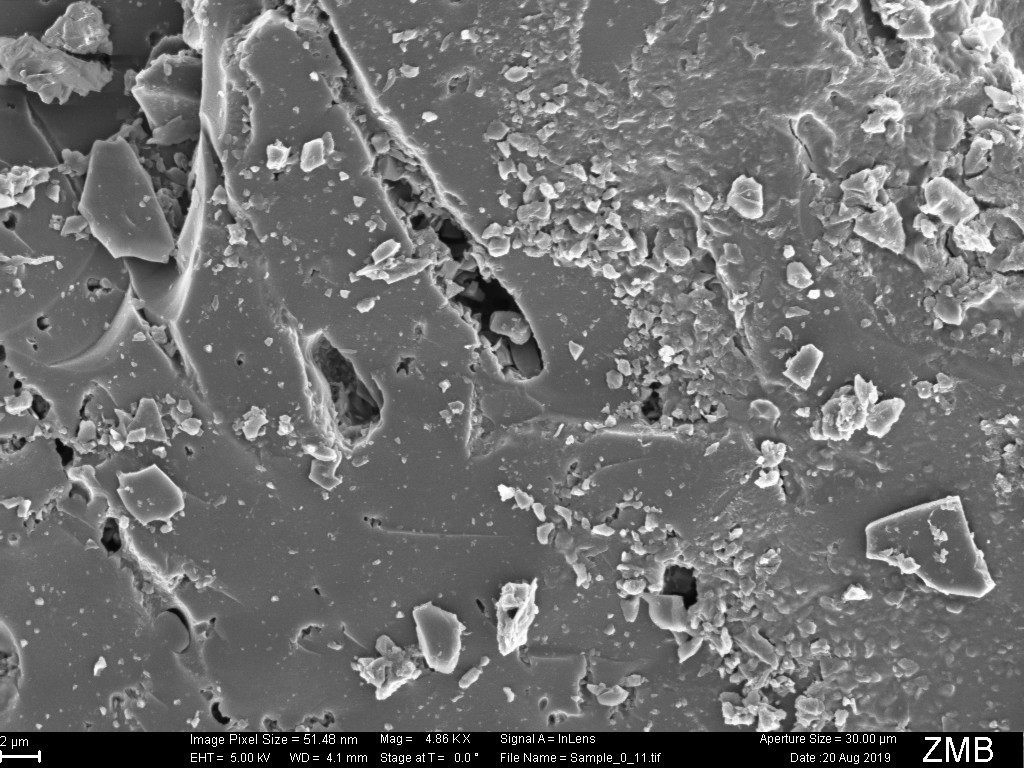
Coconut charcoal — untreated
4.86 KX · scale bar 2 µm
Untreated coconut charcoal used as a baseline for comparison with experimentally treated carbon samples.
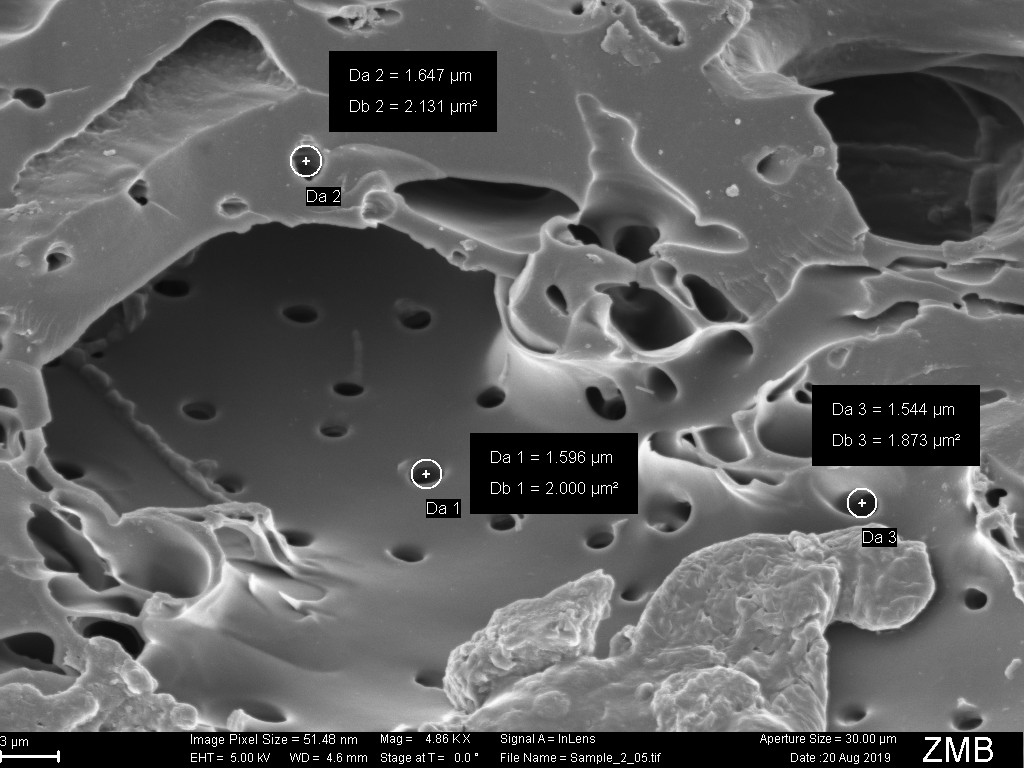
Wood charcoal — 60 min in liquid nitrogen
4.86 KX · pores 1.54 – 1.65 µm
In this experimental wood-charcoal sample, SEM imaging showed a larger number of small and large pores and increased connectivity compared with shorter-treatment observations.
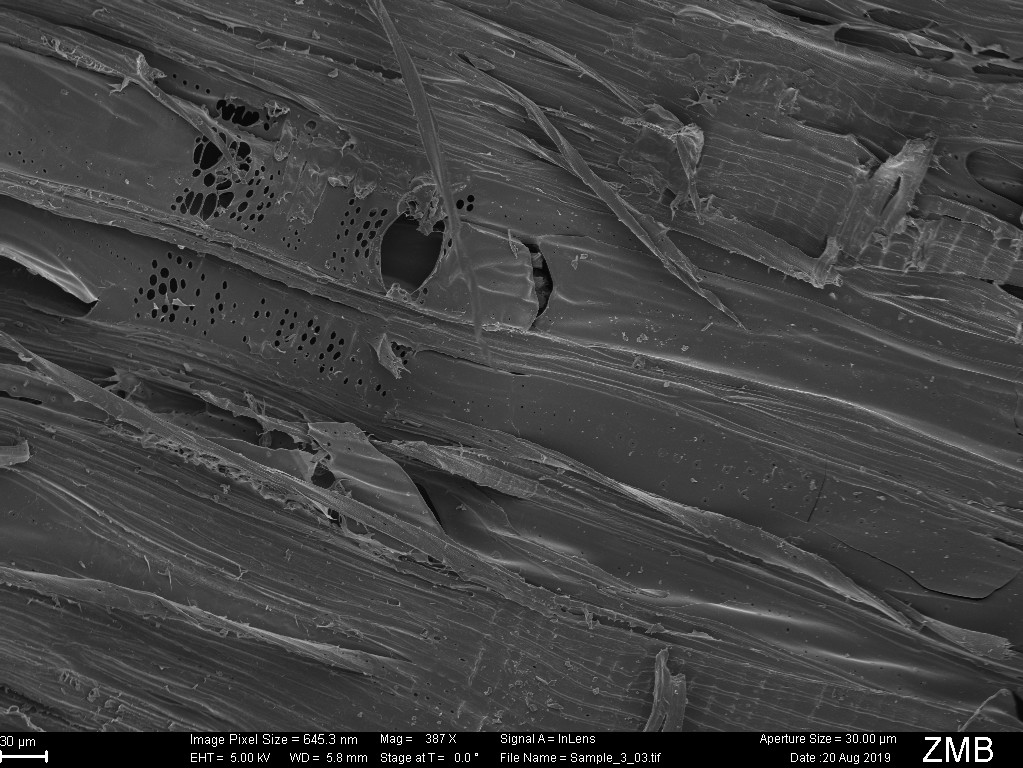
Wood charcoal — channels along the grain
387 X · scale bar 30 µm
SEM imaging revealed longitudinal channels along the wood structure and smaller microchannels. The researchers suggested that these may be structural channels inherited from the original wood architecture.
Table 2.1 · Early material characterisation
University of Zurich · 2019 experimental research
| Property | Method / source | Unit | Value |
|---|---|---|---|
| Small pore diameter | SEM, ZMB Zurich | µm | 1.54 – 1.65 |
| Large pore diameter | SEM, ZMB Zurich | µm | 25 – 30 |
| Microchannel width (wood) | SEM, ZMB Zurich | µm | 1.2 – 1.5 |
| Experimental wood-charcoal treatment | Liquid-nitrogen immersion — one experimental sample, not a production specification | min | 60 |
| Prototype carbon panel dimension | Project documentation | cm | 25 × 25 |
| Estimated cotton-fibre loading | 2019 research estimate | g / m² | ≈ 550 |
| Carbon feedstock cost assumption | 2019 research estimate | US$ / t | 70 |
| Early maintenance interval assumption | Project documentation | months | 1 – 2 |
Early SEM documentation contains inconsistent unit notation in the accompanying presentation text. Micron-scale values shown here reflect the microscopy annotations and should be confirmed against the original measurement files before being treated as final material specifications.
2019 research-stage material cost estimates
Early materials-only estimates from the UZH research programme. D-SAL estimates include carbon and cotton inputs; comparator values are historical research estimates and should not be interpreted as complete system costs or current market prices. i
03/Performance
Evaporation rate scales with incident radiation, so a yield figure means nothing without the irradiance beside it. Laboratory, integrated-system and projected values are reported separately here and never combined into a single performance claim.
Table 3.1 · Evaporation rate as a function of irradiance
| Irradiance | W / m² | L / hour / m² | Condition | Provenance |
|---|---|---|---|---|
| 1.0 sun | 1000 W / m² | 2.15 | Laboratory solar simulator, small carbon sample. Peak runs reached 2.2. | Measured |
| 0.7 sun | 700 W / m² | 1.54 | Conservative estimate derived from outdoor experiments. | Projected |
| 0.6 sun | 600 W / m² | 1.32 | Conservative estimate derived from outdoor experiments. | Projected |
| 0.5 sun | 500 W / m² | 1.10 | Outdoor experiment, 12-hour average irradiance. | Measured |
Table 3.2 · Yield, cost and provenance
| Figure | Value | Unit | Provenance |
|---|---|---|---|
| Integrated solar-still system | 12 – 15 | L / day / m² | Reported |
| Laboratory sample, 1.0 sun | 2.15 – 2.2 | L / hour / m² | Measured |
| Scaled 20 × 20 cm demonstrator (KAUST) | ≈ 1.0 | L / hour / m² | Measured |
| Increase vs. underlying solar still | > 200 | % | Reported |
| Annual yield, 8 – 12 h usable sun | 3,212 – 4,818 | L / m² / year | Projected |
| Adsorber module cost | ≈ 16 | US$ / m² | Projected |
| Consumable renewal, 4× per year | ≈ 6.40 | US$ / m² / year | Projected |
| Water per US$ 1 of consumables | 500 – 769 | L | Projected |
| Material efficiency per dollar | 1.39 | kg h⁻¹ $⁻¹ | Reported |
| Family-scale water cost, 8 m² unit | ≈ 0.002 | US$ / L | Reported |
Cost figures cover adsorber materials and renewal only — not the condensing enclosure, fabrication, labour, storage, distribution or installation — and are not price quotations.
Reported · Advanced Sustainable Systems, 2021. The 8 m² family-scale cost estimate is based on the paper's 2019 research-stage material-cost model and assumes the system can meet the daily freshwater needs of a four-person household at a cost of around US$0.002 per litre of water produced.
04/Why it wins
Desalination has no single solution. Reverse osmosis dominates where grid power, pressure and technical maintenance exist. D-SAL is engineered for everywhere else: distributed, off-grid, low-pressure, low-maintenance sites with brackish or contaminated water.
Table 4.1 · Technology comparison matrix
| Dimension | D-SAL | Reverse osmosis | Solar still | Solar-powered RO | Membrane distillation |
|---|---|---|---|---|---|
| Driving mechanism | Solar evaporation at the interface | Hydraulic pressure across a membrane | Solar evaporation in an enclosure | Hydraulic pressure, solar-generated | Thermal gradient across a membrane |
| Electricity | Not required for evaporation | Required | Not required | Required (solar-supplied) | Usually required |
| Pressure | No high-pressure pumping | High | None | High | Low |
| Chemicals | No process chemicals required | Pretreatment / cleaning | None | Pretreatment / cleaning | Antiscalant may be used |
| Moving parts | Few / system-dependent | Pumps, valves, motors | Minimal | Pumps, valves, motors | Pumps, heat circuits |
| Maintenance | Designed for low-maintenance settings | Technical maintenance | Cleaning of glazing / basin | Technical maintenance | Membrane management |
| Capital intensity | Low to moderate (projected) | Moderate to high | Low | Moderate to high | Moderate |
| Operating intensity | Low (projected) | Energy and maintenance driven | Low | Maintenance driven | Thermal energy driven |
| Typical scale | Household to small community | Small to very large plants | Household | Small to medium | Niche / industrial |
| Best fit | Off-grid, rural, agricultural, brackish groundwater | Municipal and industrial supply | Very small household use | Remote sites with PV capacity | Waste-heat streams |
Comparison reflects general technology characteristics and D-SAL’s intended distributed-use context. Detailed performance, energy, cost and maintenance requirements vary substantially by system design, feedwater, scale and operating conditions.
Comparative statements describe design intent and documented characteristics. They are not a claim of superiority over reverse osmosis, which remains the appropriate technology at municipal and industrial scale.